

Graph information
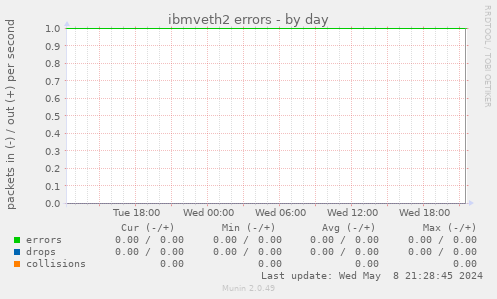
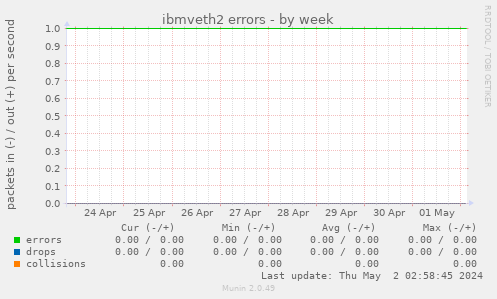
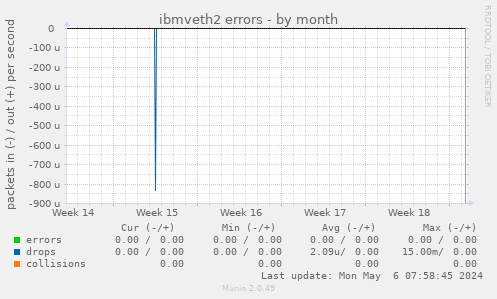
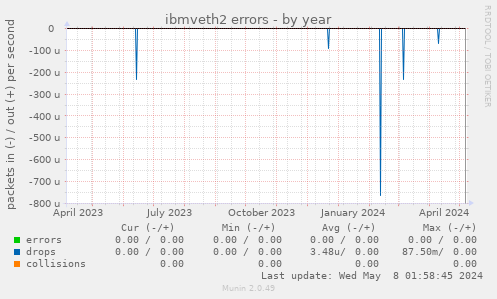
This graph shows the amount of errors, packet drops, and collisions on the ibmveth2 network interface.
| Field | Internal name | Type | Warning | Critical | Info |
|---|---|---|---|---|---|
| errors | trans | counter | 1 | ||
| drops | txdrop | counter | |||
| collisions | collisions | counter |


This graph shows the amount of errors, packet drops, and collisions on the ibmveth2 network interface.
| Field | Internal name | Type | Warning | Critical | Info |
|---|---|---|---|---|---|
| errors | trans | counter | 1 | ||
| drops | txdrop | counter | |||
| collisions | collisions | counter |